OPTEIO turns visitor traffic into a management tool

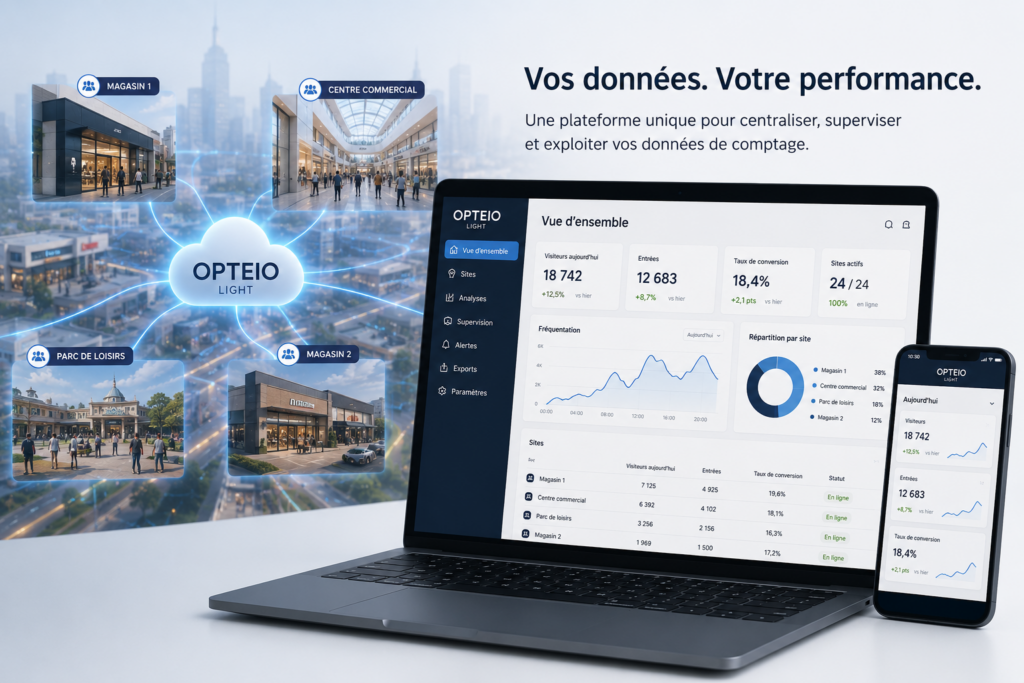
Much more than a people-counting dashboard. OPTEIO centralises data from your My People Counter sensors, analyses, compares and enriches it to give you an operational view of your sites.

Real-time data, heatmaps, multi-site comparisons, weather, external data, reports and exports: move from measurement to decision-making in a single environment.

OPTEIO Light, plateforme d'analyse des données de fréquentation

Understand everything from real time to annual trends

OPTEIO provides several levels of analysis from the same data, supporting both daily operations and network management.

Real time & occupancy

Entrances, exits, real-time presence and occupancy according to site configuration.

H / D / W / M / Y

Analysis by hour, day, week, month or year with history and comparisons.

Weekly heatmap

Immediately visualise the busiest days and time slots.

Cross-analysis

Compare several sites or periods in a single view.

Multi-site dashboard

Move from a network overview to detailed indicators for each location.

Zones & flows

Analyse entrances, spaces and zones when the counting architecture allows it.

Tableau de bord OPTEIO Light pour analyser la fréquentation

A comparative view to manage a network

OPTEIO is designed to compare locations and periods, not just display isolated charts. Multi-site analysis makes it possible to identify the best-performing sites, detect unusual gaps and understand how each location evolves.

  • Comparison of multiple sites
  • Comparison of periods
  • Ranking and internal benchmarking
  • Trend evolution
  • Site-by-site or consolidated view

Put visitor traffic into context

Visitor numbers alone do not explain an increase or decrease. OPTEIO enhances analysis with external and business data to better understand what really influences your sites.

  • Weather: temperature and weather conditions, including historical data.
  • Territorial data: INSEE indicators and socio-economic data when relevant to the use case.
  • Seasonality: holidays, weeks, months, years and specific periods.
  • Business data: the ability to correlate footfall with sales, opening hours, events or other available sources.
Centralisation de données de comptage existantes dans OPTEIO Light

Indicators that become immediately readable

OPTEIO views are designed to quickly identify peaks, dips, trend breaks or differences between sites. Weekly heatmaps and comparative views make patterns easier to understand.

Reports, PDF and automated distribution

Analyses should not remain locked inside the platform. OPTEIO makes it easy to distribute them to teams and company tools.

  • PDF reports
  • Automatic delivery by email
  • Excel and CSV exports
  • Automated exports and deposits depending on the project
  • API for business integrations
  • Detailed data down to the minute depending on configuration

A complete solution, not just software

With OPTEIO, My People Counter manages the entire process: site assessment, sensor selection and positioning, installation, calibration, data collection, analysis, monitoring, maintenance and ongoing support.

This continuity between on-site equipment and the platform helps keep data reliable over time and prevents measurement issues from becoming misleading decision-making indicators.

Supervision et contrôle des données de fréquentation

OPTEIO or OPTEIO Light?

OPTEIO

The complete My People Counter solution. If you want to create or upgrade your counting system, we manage sensors, deployment, platform and ongoing support.

OPTEIO Light

Already equipped? Keep your own counters and connect their data to OPTEIO when their access method is compatible.

Frequently asked questions about OPTEIO

What is the difference between OPTEIO and OPTEIO Light?

OPTEIO is the complete My People Counter solution: assessment, sensors, installation, calibration, collection, analytics platform, supervision and support. OPTEIO Light is designed for organisations that already have compatible counting equipment.

Can OPTEIO compare several sites?

Yes. The platform consolidates a network, compares sites or periods and lets you move from a global view to each location.

Can we visualise the busiest days and hours?

Yes. Time analyses and heatmaps quickly identify strong and weak time slots according to available data.

Can weather and external data enrich the analysis?

Yes. OPTEIO can place visitor traffic in context with weather and, depending on the project, territorial, statistical or business data to help explain variations.

Can data be exported or sent automatically?

Yes. Depending on configuration, OPTEIO supports Excel or CSV exports, PDF reports, automated email delivery, automated file exchanges and API integration.

Move from counting to managing visitor traffic

One site, a network or hundreds of locations: let’s build the indicators and analyses suited to your activity.