Understand your visitors to better manage museums, parks and leisure sites

In a museum, park, tourist attraction or tourism office, visitor traffic varies with seasons, opening hours, exhibitions, events and weather. Reliable data helps you understand these variations and prepare operations.

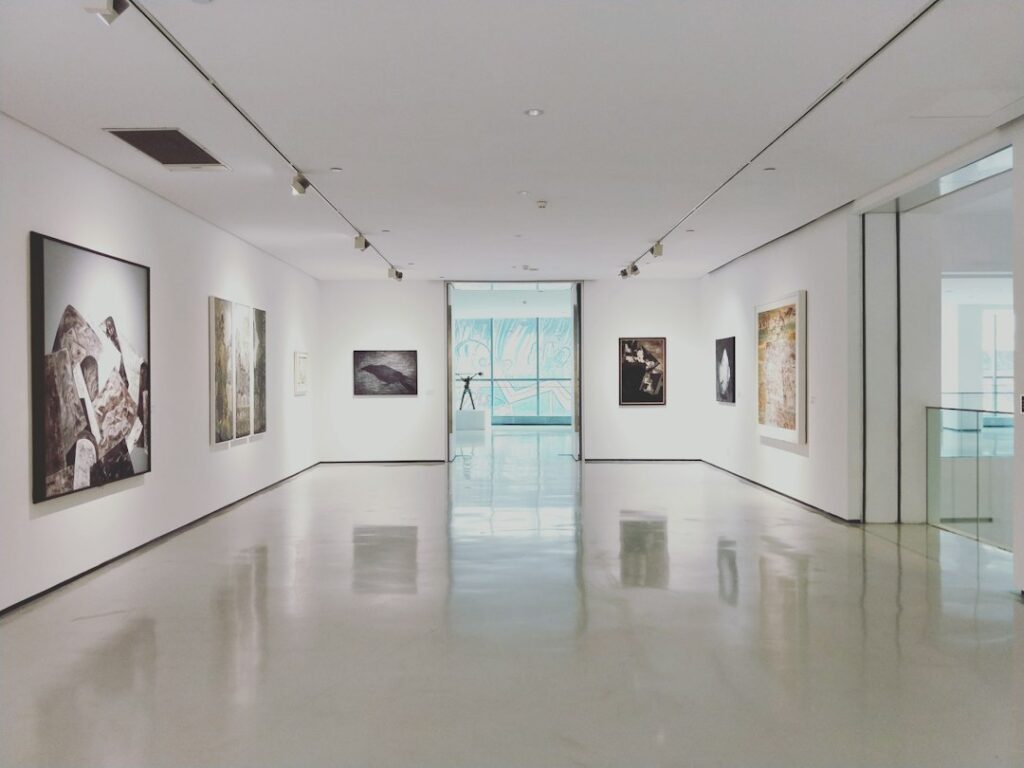
Espace de musée illustrant l'analyse de la fréquentation des visiteurs

KPIs that give meaning to visitor traffic

Counting becomes truly useful when it helps understand usage and supports decisions.

◎ Visitor traffic

Track entrances and exits and compare opening periods, seasons and years.

▦ Zones & visitor journeys

Measure traffic in buildings, rooms or zones to better understand visitor journeys.

◉ Occupancy

Monitor real-time presence when operations require knowing how many people are on site.

◷ Visit peaks

Identify busy periods to adapt reception, teams and organisation.

↗ Exhibitions & events

Measure the effect of an exhibition, activity or event on visitor traffic.

☼ Weather & seasonality

Analyse variations against the calendar and weather to better interpret trends.

From the site entrance to visitor journeys

Depending on requirements, counting can be deployed at the main entrance, by building, exhibition or strategic zone. OPTEIO then consolidates these measurements into a consistent view.

UNDERSTAND MORE TO WELCOME BETTER

◎ Visitor traffic becomes a management tool

Reliable data moves decisions beyond impressions: anticipate peaks, measure exhibition attractiveness, size reception resources and understand long-term trends.

Sites that trust us

We equip numerous cultural and leisure destinations, including Nausicaá, Puy du Fou, the Museum of Resistance and Deportation in Besançon, the Musée de la Romanité in Nîmes, Louvre-Lens, SpeedPark, Follow Park Lille, the swimming pool in Les Epesses and Bayeux Aventure. Our solution is also used by more than 600 tourist information offices.

Each architecture is sized according to entrances, flows to be measured and the indicators genuinely useful to the site.

From sensor to actionable data

◎ Measure

Sensors adapted to entrances, rooms, buildings and site constraints.

Analysis by zone, period or event to objectively understand usage.

↗ Anticipate

Historical data to prepare teams, reception and future periods.

Frequently asked questions

Why count visitors to a museum or park?

To measure actual visitor traffic, monitor changes, anticipate peaks and objectively assess the attractiveness of spaces, exhibitions or events.

Can we know how many people are currently present?

Yes. With a suitable entrance/exit architecture, real-time occupancy can be calculated.

Can several rooms or zones be measured?

Yes. Multiple counting points can track flows between buildings, rooms, exhibitions or park zones.

Can weather be compared with visitor traffic?

Yes. Weather context helps tourist and leisure sites interpret changes in visitor traffic.

Calculate your potential for free

Let’s discuss your project

Tell us about your site, entrances and the indicators you want to monitor. We will help you build measurement suited to your uses.