Understand shopping-centre flows to better manage attractiveness

Counting visitors is the first step. The next challenge is understanding how traffic changes by entrance, day, time and zone so you can manage the site more effectively.

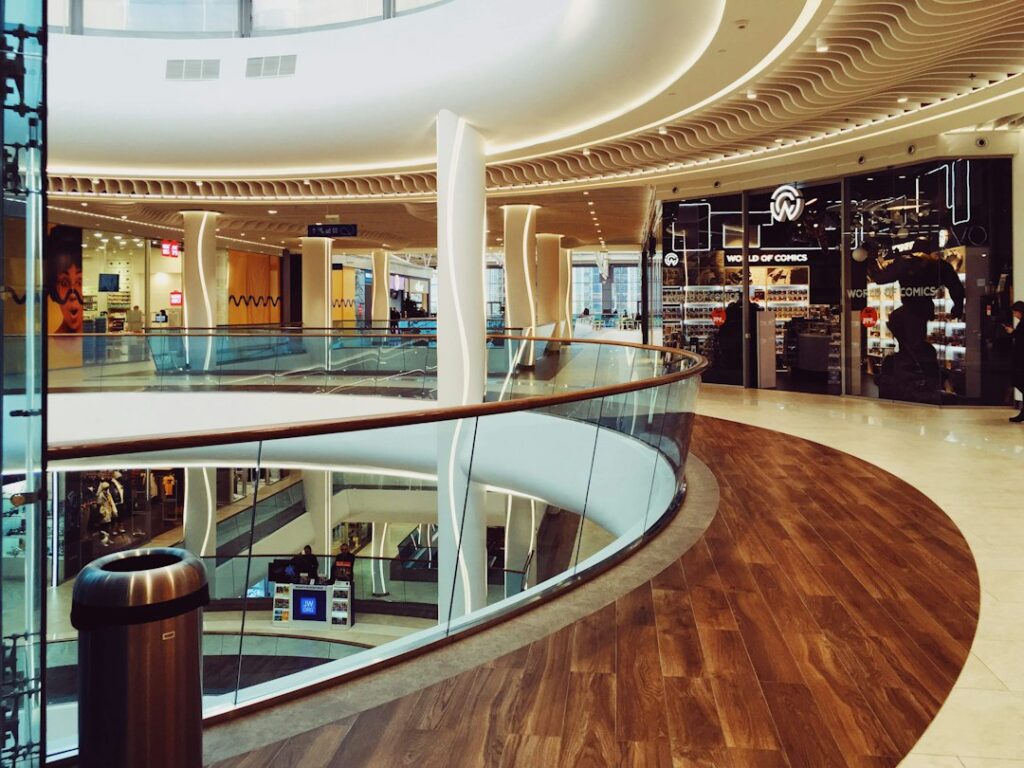
Allée de centre commercial pour illustrer la mesure des flux de visiteurs

KPIs that give meaning to visitor traffic

Counting becomes truly useful when it helps explain usage and supports decisions.

◎ Total visitor traffic

Accurately measure visitors and follow changes by day, week, month or year.

⇄ Flows by entrance

Compare entrances to understand their contribution to total traffic.

▦ Zones & spaces

Analyse flows between zones, galleries or floors when the site architecture allows it.

◷ Traffic peaks

Identify the busiest hours and days to adapt operations, security and services.

↗ Events & campaigns

Measure the impact of an event, animation or commercial campaign on traffic.

☼ Context & seasonality

Compare periods and place variations in context, including weather and calendar effects.

A consolidated view from each entrance to the entire site

The different counting points are centralised to provide consistent data across the entire shopping centre. You can compare entrances, monitor trends, analyse peak periods and share objective performance indicators with your teams and partners.

FROM VISITOR TRAFFIC TO ATTRACTIVENESS

◎ Data that explains flows, not just entrances

The objective is not simply to know the number of visitors. It is to understand when, where and how traffic changes to manage the site more effectively.

Sites that trust us

Shopping centres and galleries within E.Leclerc, Super U and Intermarché networks use our counting solutions to monitor visitor traffic and flows.

Each architecture is sized according to entrances, flows to be measured and the indicators genuinely useful to the site.

From sensor to actionable data

◎ Measure

Counting points adapted to entrances and the centre’s configuration.

▦ Consolidate

A global view built from the different entrances and zones.

Trends and comparisons that make visitor variations understandable.

Frequently asked questions

Why measure shopping-centre traffic?

To monitor attractiveness, compare periods, understand the contribution of different entrances and measure the effect of campaigns or events.

Can several entrances be consolidated?

Yes. Multiple counting points can be aggregated to build total site traffic while retaining analysis by entrance.

Can different zones be analysed?

Yes. When measurement points are positioned between zones or floors, internal flows and distributions can be analysed.

Can the data be exported?

Yes. Data can be analysed in OPTEIO, exported or integrated into other tools via API.

Let’s discuss your project

Tell us about your site, entrances and the indicators you want to monitor. We will help you build measurement suited to your uses.